“If it seems like the government isn’t working for the people, part of the problem is they’re effectively being bribed, very often by lobbyists,” reads a statement by Represent Us, an anti-corruption campaigning group.
“Because they’ve become dependent on money from lobbyists to fund their political careers, Congress ends up passing laws to keep the lobbyists and their clients happy, instead of laws that benefit the American people.”
Some Members of Congress even have substantial personal stakes in fossil fuels.
Greg Gianforte, now the Governor of Montana, was the state’s sole representative in the House from 2017.
As well as benefitting from lobbyists, he had just shy of $5 million in fossil fuel investments as of 2019.
Gianforte uniformly voted against climate change measures during his time in the House, and he recently accused Biden of pandering to “radical environmentalists” for opposing the Keystone XL pipeline – despite a recent poll showing that a majority of registered voters with an opinion on the matter support cancelling the project.
With today’s announcement that the US is aiming to cut carbon emissions to 50% of 2005 levels in the next ten years, the pressure will be on Congress to pass strong climate policy in the immediate future.
It remains to be seen whether Congress will catch up with popular opinion and meet the country’s new, ambitious target, or if party politics and vested interests will continue to keep environmental bills from being signed into law.
Methodology
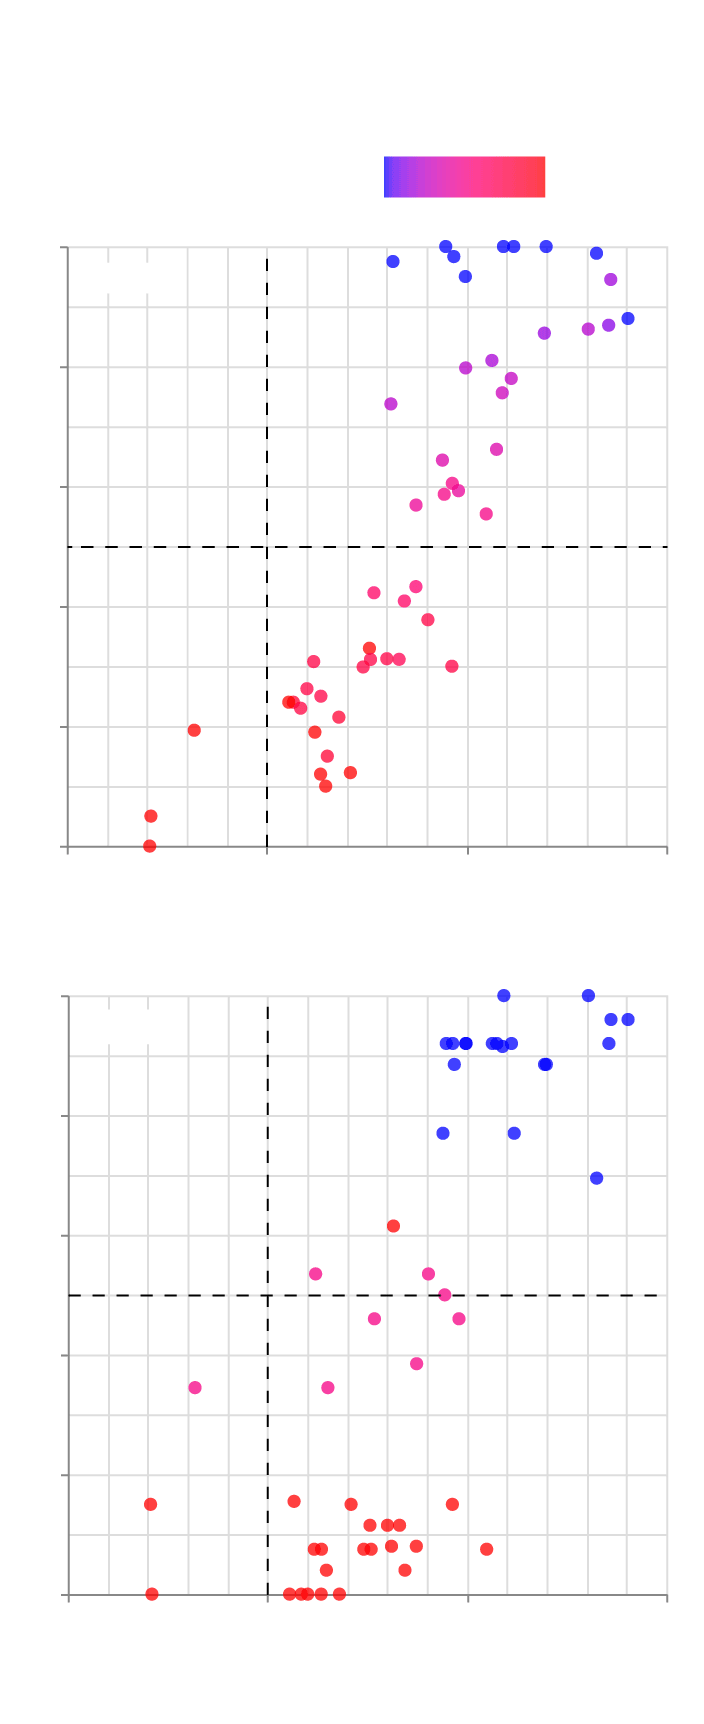
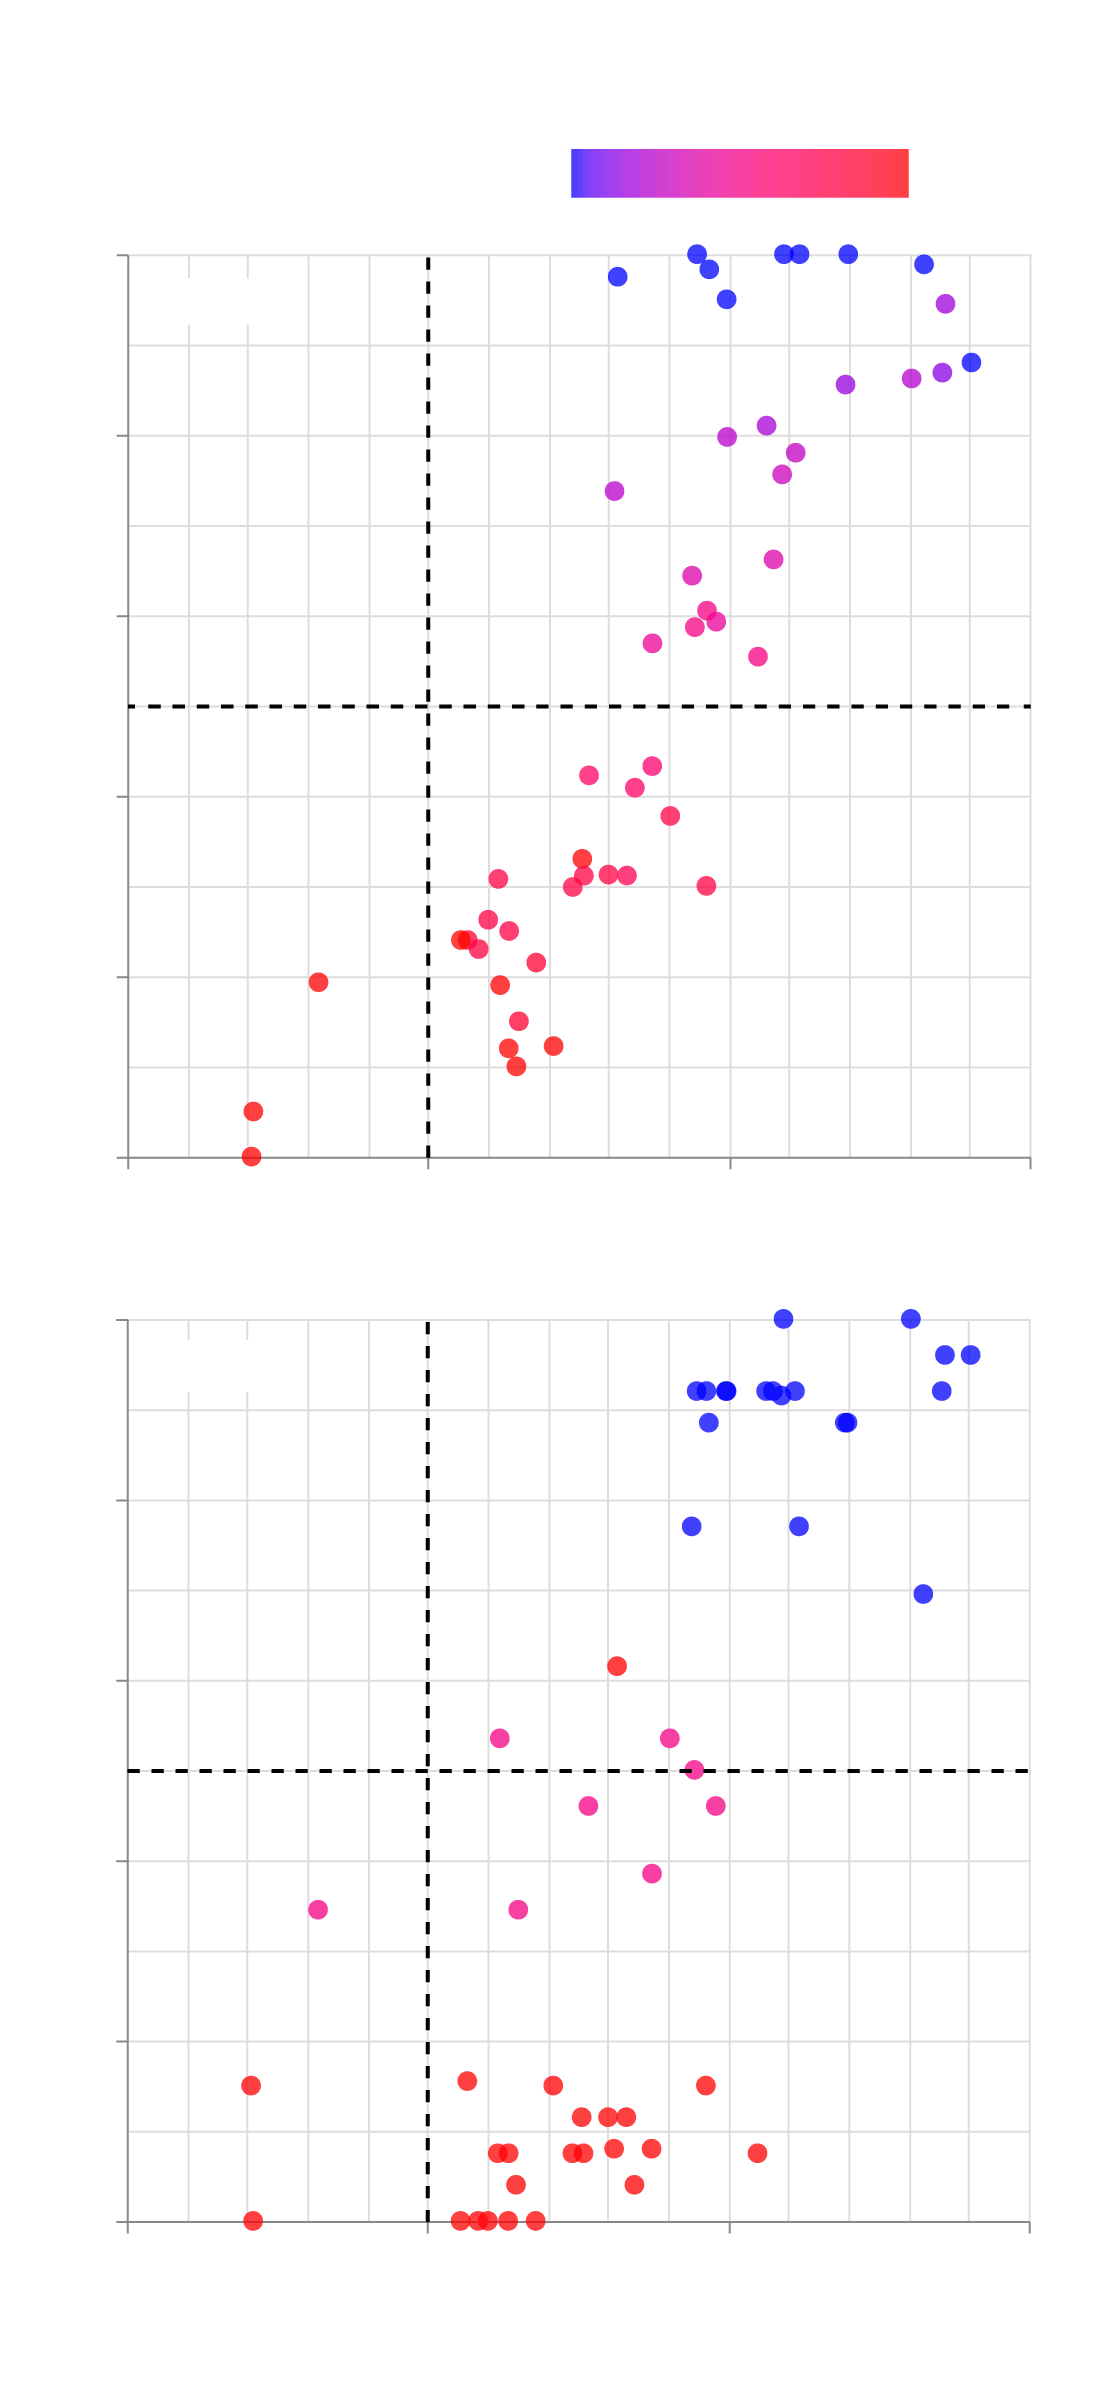
I used data from the Yale Climate Opinion Maps to find state-by-state opinions on climate-related positions; data from the League of Conservation Voters to find voting records of each Member of Congress on environmental policy; and data from OpenSecrets to find how much every Member of Congress gets from fossil fuel lobbyists.
I grouped the voting records of every House Representative and Senator into their states in order to plot them against state opinion polls.
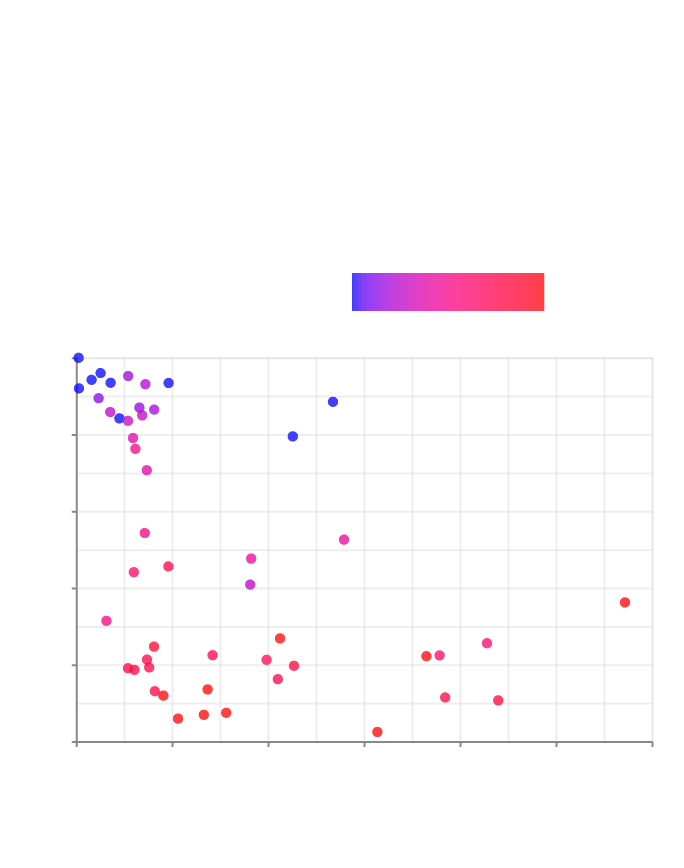
For the final graph, I grouped House and Senate votes together, with equal weight given to both chambers, to come to a culumative state environmental voting record.
The color gradient for Democratic/Republican control was arrived at by dividing the number of Democrats by the total number of Congresspeople.
This gave a 0 to 1 range that was mapped onto a red-to-blue scale.
For the final graph, I again grouped the House and Senate together with equal weight given to both chambers.
This method does exclude independents, but using a color scheme that included them seemed to confuse the article without changing the conclusions.
Graphs were made in Altair and tweaked in Illustrator.
I used the New York Times’ aitohtml tool to make the images responsive, and included different versions for viewing on mobile.
This methodology plots opinions on climate change against votes on environmental legislation.
Climate change policy is a major part of environmental policy, but it is important to note that the two are not identical.
Votes on the environment more broadly were used here because 1) the data was more readily available, 2) far more data exists for general environmental policy, making it more possible to find trends, and 3) positivity towards environmental legislation correlates strongly (and overlaps) with positivity towards climate legislation, making it a reasonable proxy.
–
Header photo credit Andy Feliciotti